Parametric plots
Axl.parametric — Function.Plot the parametric surface f: (u,v) -> [x,y,z] for u in the interval X, v in the interval Y.
parametric((u,v)->[u,v,cos(2*u*v)], 0.0 => 2.0, -pi => pi, field=DistField(0.0,0.0,0.0))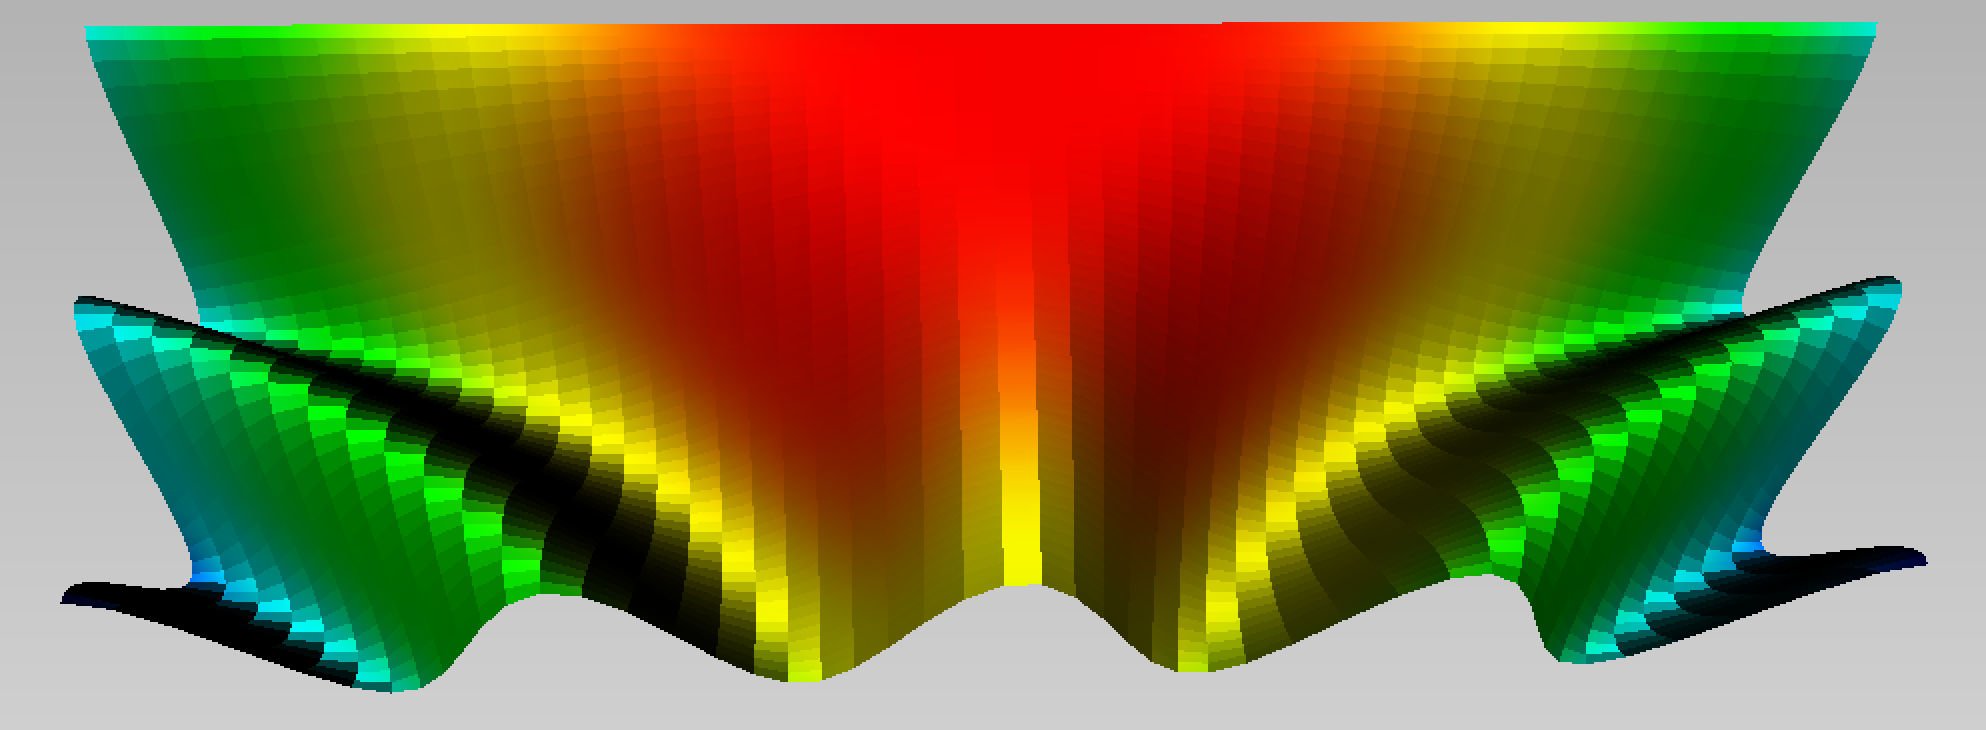
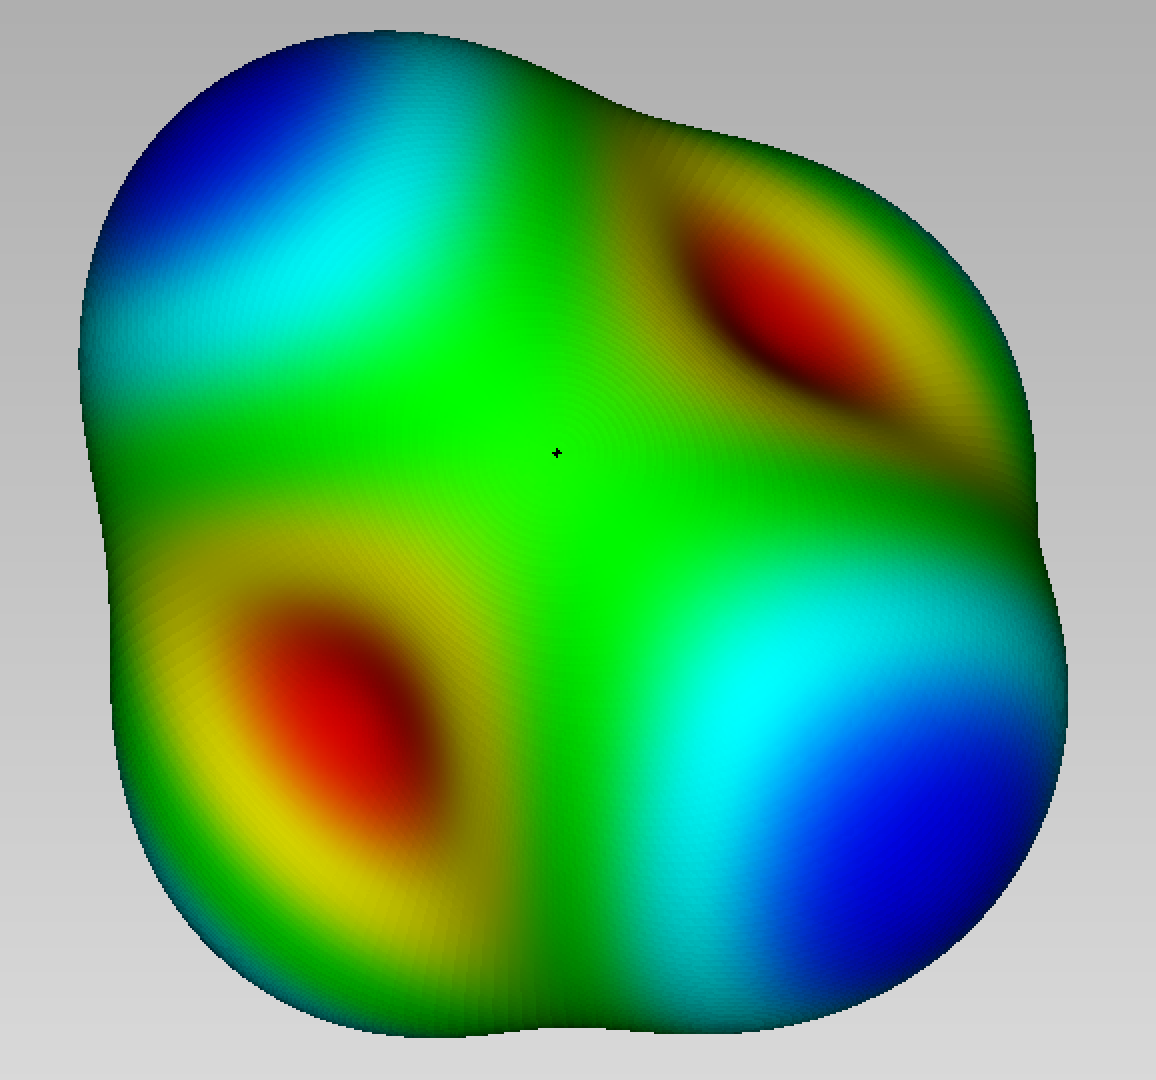
Axl.polar — Function.Plot the radius function r = f(x,y,z) on the unitary sphere.
polar((x,y,z)->cos(x*y*z+1.0), 200, field=DistField())