Mesh
- A mesh is defined by its number of vertices, edges and faces, a sequence of point coordinates, a sequence of egdes and a sequence of faces.
- The sequence of point coordinates is given as a sequence of coordinnates x_i, y_i, z_i.
- An edge is described by its number of vertices and the sequence of indices of its vertices.
- A face is described by its number of vertices and the loop of indices of its vertices.
Type: axlMesh
Format:
 <mesh name="Mesh0" size="0.05" color="32 128 255 1">
  <count>4 1 4</count>
  <points>
    0 0 0
    1 0 0
    0 1 0
    0 0 1
  </points>
  <edges>
    4 0 1 2 3
  </edges>
  <faces>
    3 0 1 2
    3 1 2 3
    3 2 3 0
    3 1 0 3
  </faces>
 </mesh>
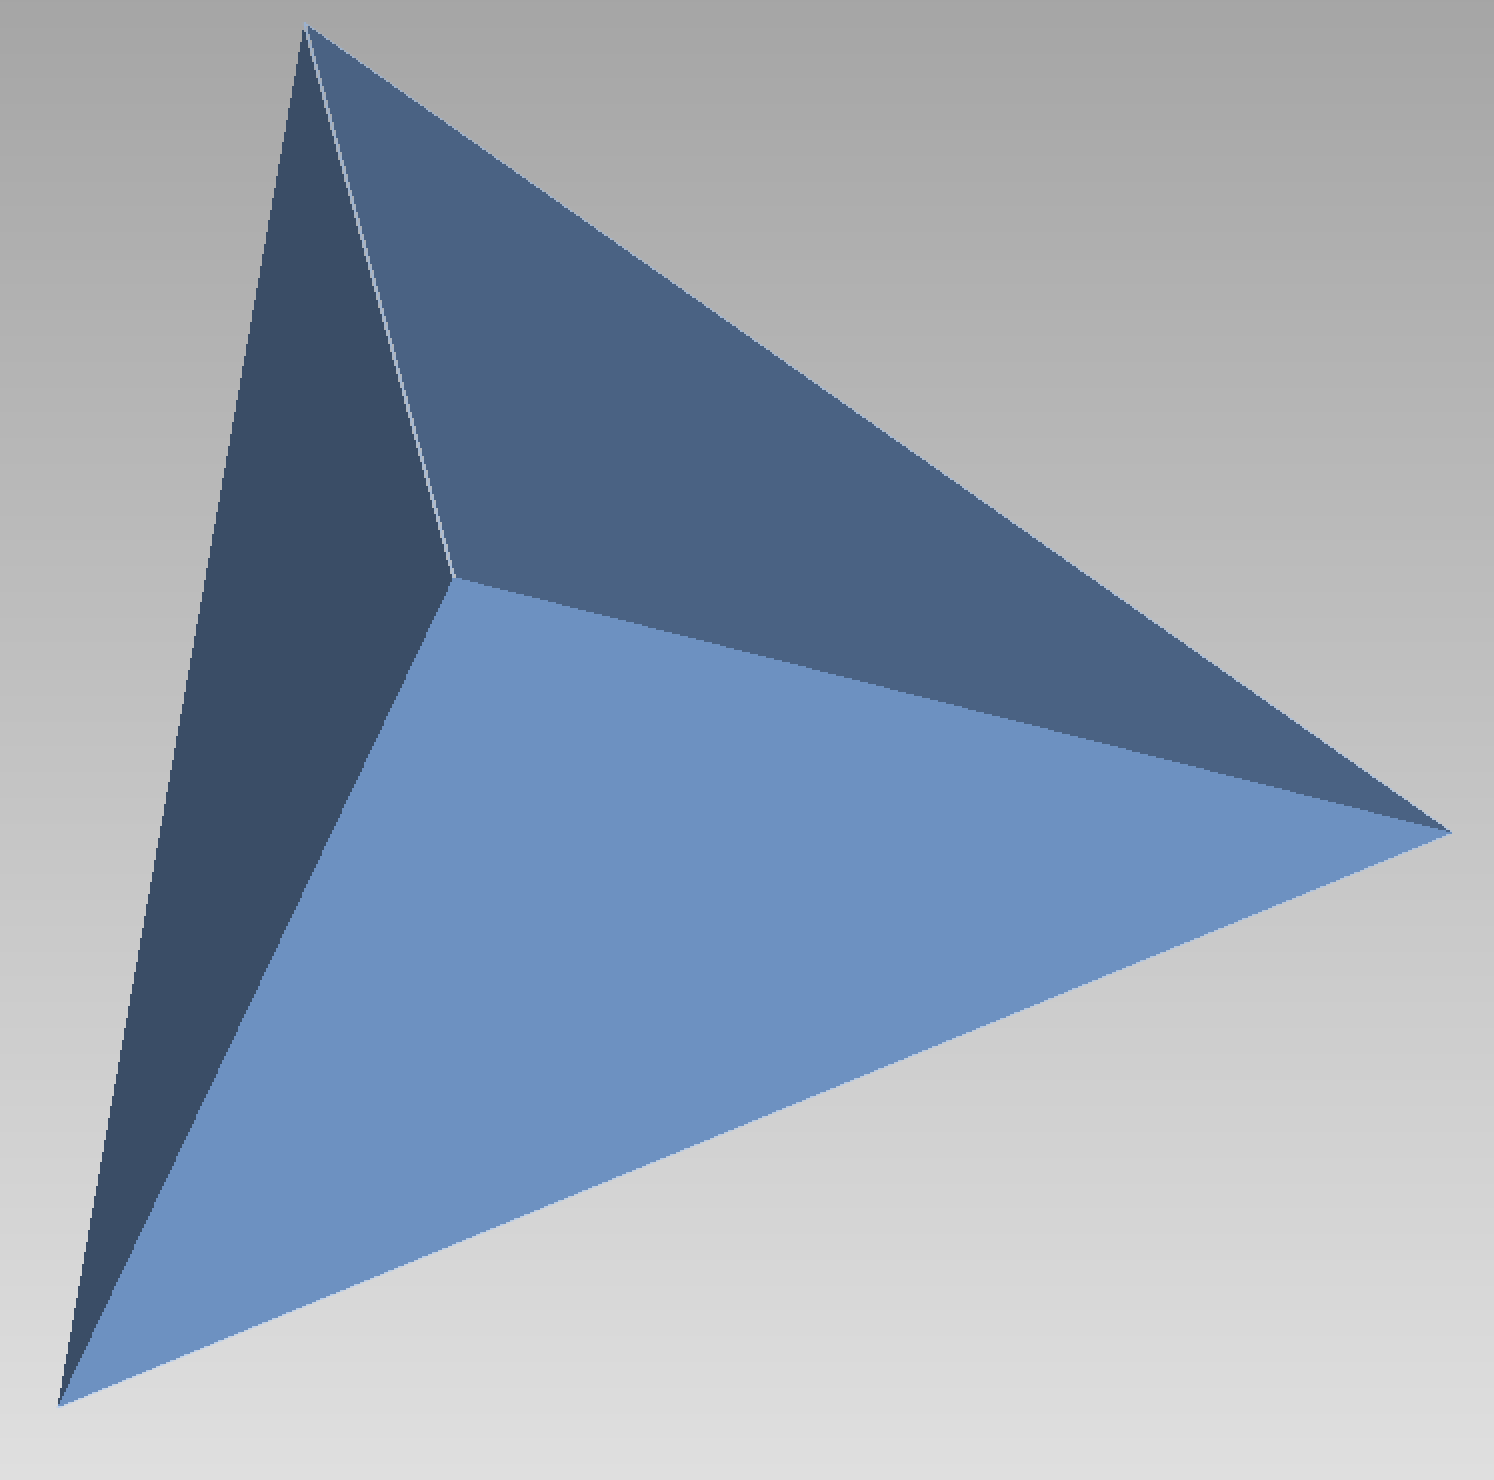
This example describes a mesh with 4 vertices, 1 edge and 4 faces. The egde is connecting the vertices of indices 0, 1, 2, 3. The faces are 4 triangles which are connecting 3 vertices among the 4. This mesh corresponds to a tetrahedron with an edge containing 4 triangle sides marked on it.
Point set
A point set can be represented as a mesh, with no edges and faces:
<mesh>
   <count>4 0 0</count>
   <points>
     0 0 0
     1 0 0
     0 1 0
     0 0 1
   </points>
</mesh>
Mesh with colored points
Optionally, the points can be colored, by listing their colors in r g b format with r, g, b integers in [0, 255]. The ith color corresponds to the ith point. Thus the number of colors should the same as the number of points:
<mesh>
   <count>4 1 4</count>
   <points>
     0 0 0
     1 0 0
     0 1 0
     0 0 1
   </points>
   <colors>
     100 100 100
     255 0 0
     0 255 0
     0 0 255
   </colors>
   <edges>
     4 0 1 2 3
   </edges>
   <faces>
     3 0 1 2
     3 1 2 3
     3 2 3 0
     3 1 0 3
   </faces>
</mesh>
The color of the points can also be defined as follows:
<mesh>
   <count>4 1 4</count>
   <points color="rgb">
     0 0 0 100 100 100
     1 0 0 255 0 0
     0 1 0 0 255 0
     0 0 1 0 0 255
   </points>
   <edges>
     4 0 1 2 3
   </edges>
   <faces>
     3 0 1 2
     3 1 2 3
     3 2 3 0
     3 1 0 3
   </faces>
</mesh>
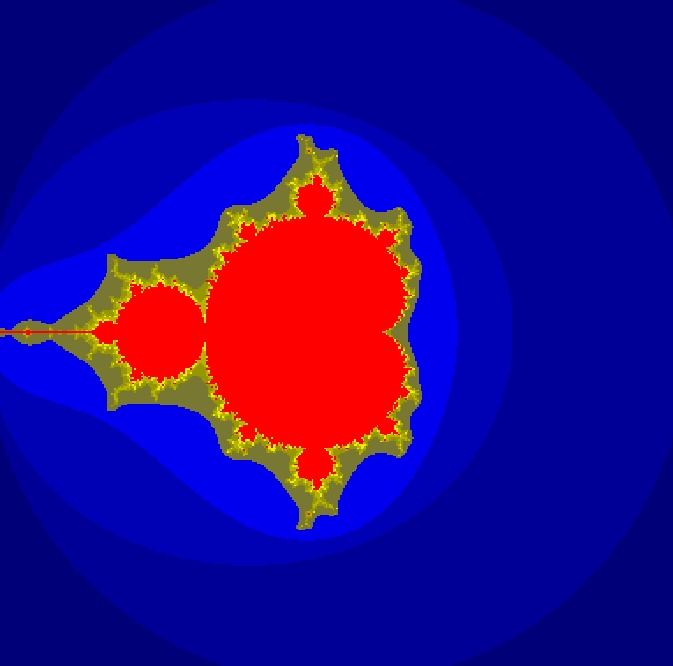
Here is an example of colored point-set, representing a Mandelbrot set:
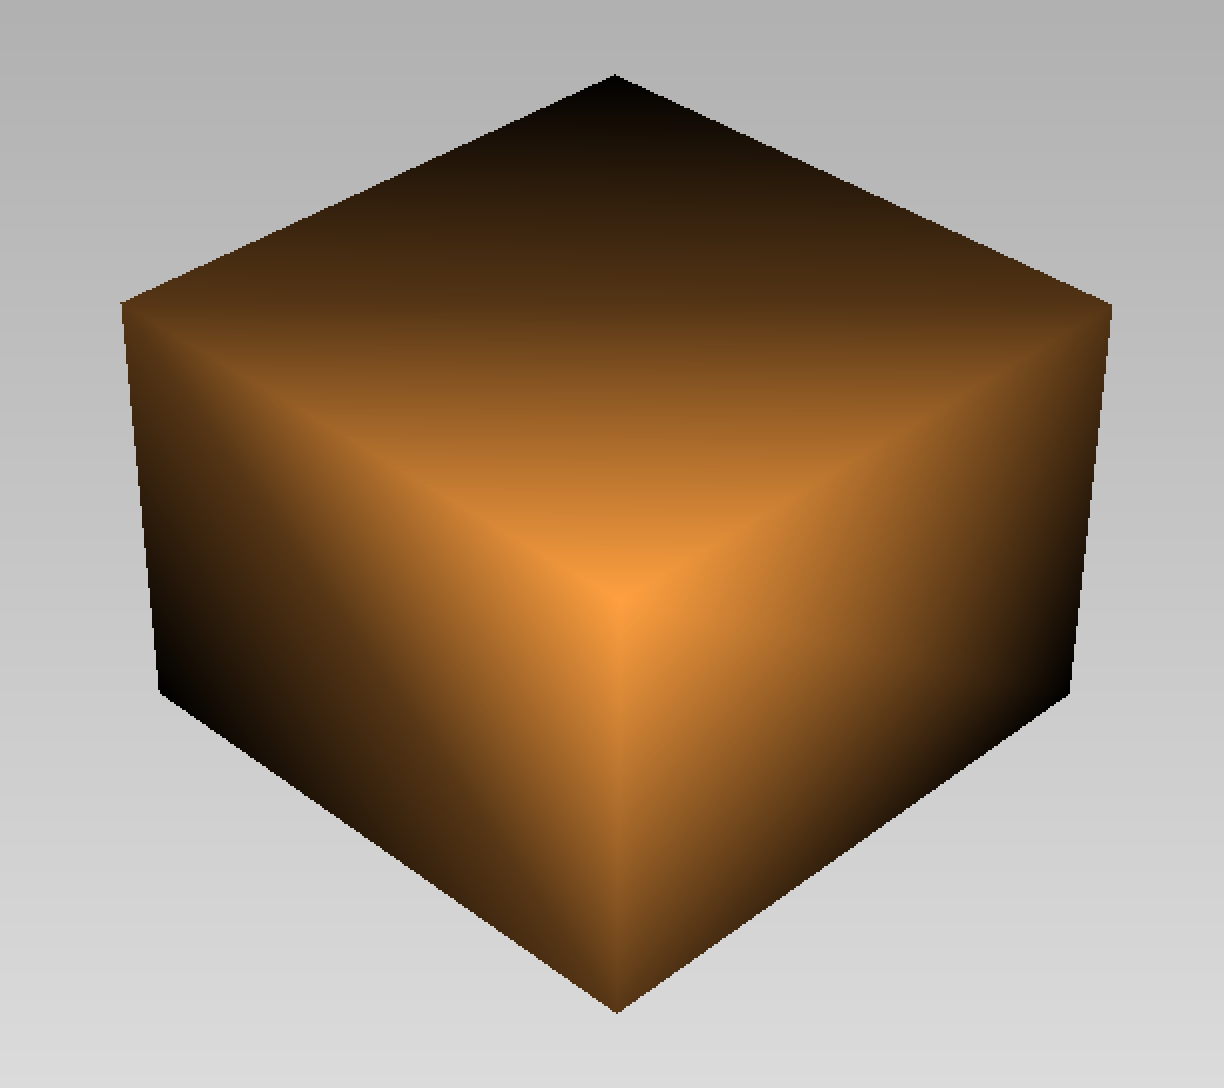
Mesh with normals
Optionally, the normal vectors can be attached to points can be colored, by listing them in a list <normals>:
<mesh  color="255 160 64" use_normal="true">
   <count>8 0 6</count>
   <points>
     1 0 -0.5
     0 1 -0.5
     -1 0 -0.5
     0 -1 -0.5
     1 0 0.5
     0 1 0.5
     -1 0 0.5
     0 -1 0.5
   </points>
   <normals>
     1 0 -0.7
     0 1 -0.7
     -1 0 -0.7
     0 -1 -0.7
     1 0 0.7
     0 1 0.7
     -1 0 0.7
     0 -1 0.7
   </normals>
   <faces>
     4 0 1 2 3
     4 4 5 6 7
     4 0 4 7 3
     4 1 5 6 2
     4 0 4 5 1
     4 3 7 6 2
   </faces>
</mesh>
The normals are used to interpolate the colors and provides a smoother rendering, when the mode Use Normals is set on and the choosen interpolation mode is Gouraud or Phong.
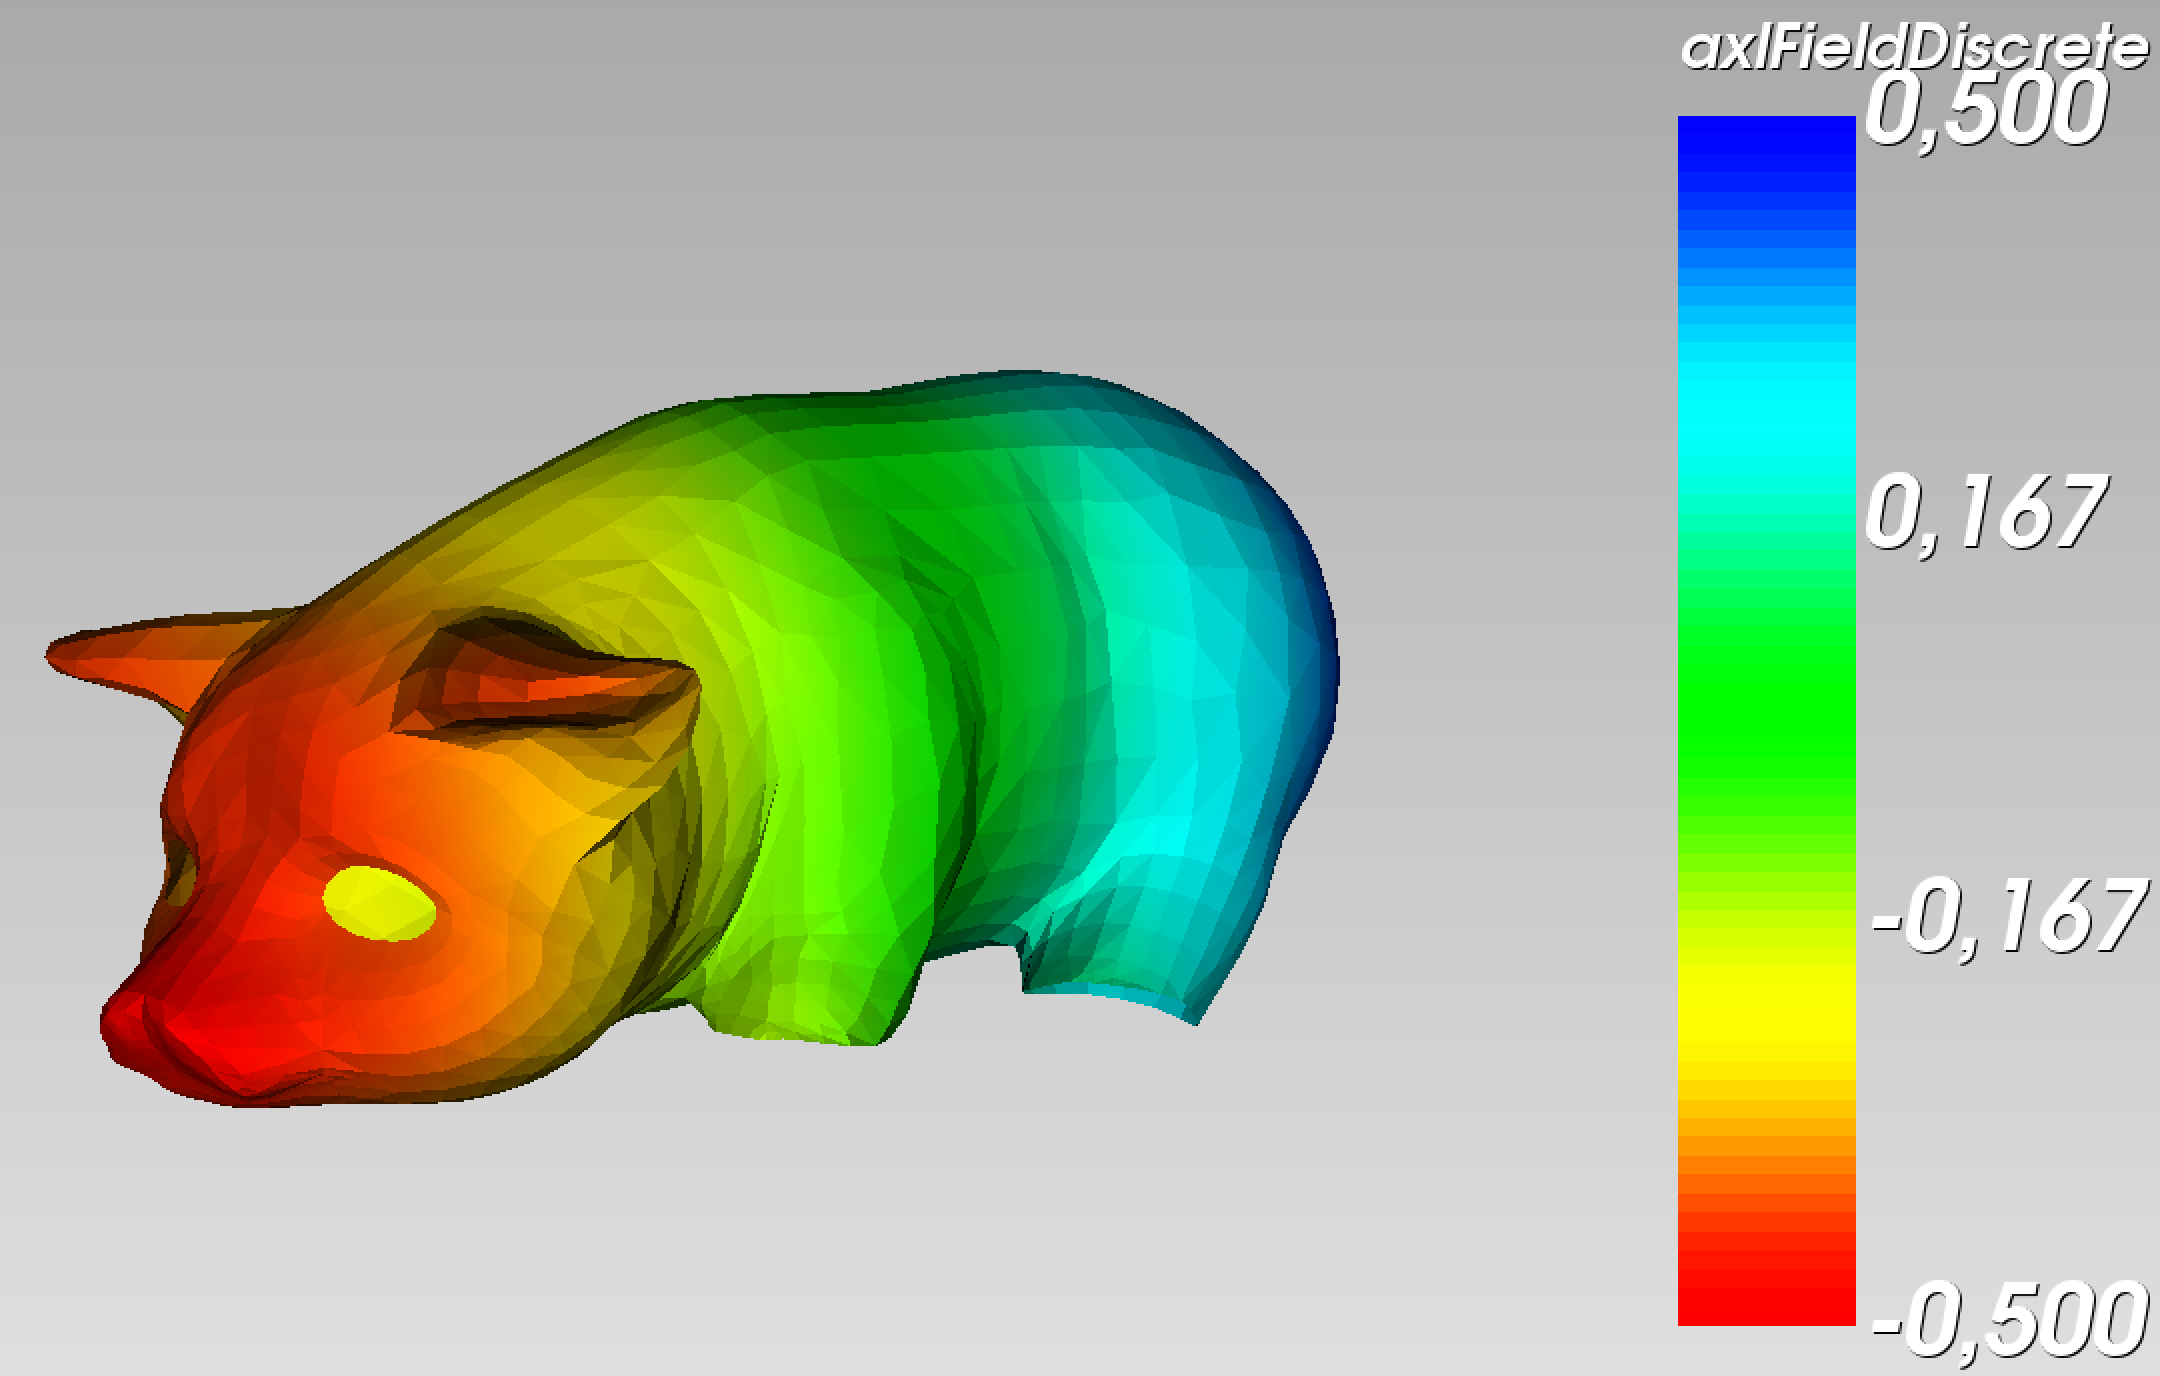
Mesh with field values
A field value can also be attached to a point of the mesh. It will be displayed by a colormap in the case of a one-dimensional field or by arrows for a 2-dimensional field.
<mesh>
   <count>4 1 4</count>
   <points>
     0 0 0
     1 0 0
     0 1 0
     0 0 1
   </points>
   <edges>
     4 0 1 2 3
   </edges>
   <faces>
     3 0 1 2
     3 1 2 3
     3 2 3 0
     3 1 0 3
   </faces>
   <field type="axlFieldDiscrete" count="4" dimension="1" support="point">
     0
     0.25
     0.5
     0.75
   </field>
</mesh>
Here is an example of a mesh, with the field corresponding to the x-coordinate represented by a colormap: